Optimizing disk usage of Zabbix and PostgreSQL
Here at Modio we use Zabbix a lot, both for production and other monitoring. We also use PostgreSQL for everything where we can, and while it's supported by Zabbix, it often feels like a second class citizen next to MySQL.
Due to reasons, we have to store a lot of historical values, for very long times in our systems, and sometimes for a lot of keys. And while SQL is great for a lot of things, time-series data is probably one of the worst when it comes to storage.
MySQL and Postgres store data a bit differently when it comes to on-disk usage, and with InnoDB data is sometimes stored interleaved with the index, making the two engines hard to compare. This post is focusing on PostgresSQL.
Simple table layout
For our example, we'll use a simple table like history_uint:
| id | clock | value |
|---|---|---|
| 1 | 1478970438 | 123 |
| 2 | 1478970439 | 222 |
| 3 | 1478970438 | 2233 |
Assuming all keys are integer, this is a s simple numerical table, with an index over (id, clock). You end up with almost as much overhead per row as you have data. Top that up with that half of the data (id, clock) will also be stored twice, in table and in the index.
For small amounts of data ( a few months ) this isn't a problem, but when you wish to store frequent data, or for longer (10 years!) of time, this causes storage requirements to grow. Just one of our installations was slightly over 300GiB of data on disk, and while this is still not big data, it is cause for some concern. For a table of say 50GiB, another 40GiB will be used for the index.
SQL is not the best format for Time-series databases, and there are several optimized datastores for just that. However, none of those integrate neatly with Zabbix.
Notable with this data is that meter based time-series data (usually) enters
the system in a chronological order, the datasets on the disk will be
organically sorted. Unlike if you do some data-reorganizing using for
example CLUSTER or pg_repack, which are strictly sorting . How data is
sorted on disk is important for how many disk seeks are done when you wish to
look at historical data for a single sensor.
Housekeeper & Clustering
The houseekeeper in Zabbix is a well known cause of performance problems. When you mix storage of data records you wish to keep "forever" with those that you only wish to keep for a while, the housekeeper will go through your dataset and delete older data that it shouldn't keep. Simply doing this, will cause holes in your database files ( on disk ).
| id | clock | value |
|---|---|---|
| 1 | 1478970438 | 123 |
| deleted | deleted | deleted |
| 3 | 1478970438 | 234 |
Then when new data is inserted, it may be placed in one of the above holes,
| id | clock | value |
|---|---|---|
| 1 | 1478970438 | 123 |
| 33 | 2015362800 | 2033 |
| 3 | 1478970438 | 234 |
The on-disk layout can in PostgreSQL be changed following an index by using
CLUSTER-command, but this requires a complete lock & rewrite of the data,
while the table is completely locked for writes & reads, and it also needs a
b-tree index on the column you wish to sort by. You can sort on-line (without a
lock) using pg_repack, but this too requires an index to sort on.
So, for this reason, we do not run the housekeeper on the history tables, and resort to other ways of cleaning out old or unwanted data.
( Note that the points about sorting data may seem irrelevant now, but will become more relevant later. )
OID removal
Our systems have been running for a few years now, and we've been keeping up to date with Zabbix releases as they come. This means that the databases themselves were created by older Zabbix scripts and then upgraded. At some point in time, Zabbix defaulted to explicitly create Postgres tables with OID enabled. In practice, this means another key to the index, and in our case, OID's had no use at all, since they would have wrapped around repeatedly in the tables.
Worth noting is that the current Zabbix database creation scripts are no longer using OID's, but the upgrade process does not remove them.
Simply iterating over all our tables and removing OID's reduced the on-disk usage of some tables with 30-50%. The total reduction on disk was pretty amazing, simply by removing OIDs, our database on disk shrunk with almost 60%!

Index readjustment
In time series workloads. you never update a row once it's on the disk, they are inserted, then read repeatedly, and maybe later removed.
With PostgreSQL 9.5 a new type of index, BRIN (Block Range INdex) were introduced. These indexes work best when the data on disk is sorted, which we have already concluded we have. Unlike normal indexes, brin only stores min/max values for a range of blocks on disk, which allows them to be small, but which raises the cost for any lookup against the index. Each lookup that hits the index must read a range of pages from disk, so each hit becomes more expensive.
With our use of Zabbix, the most common "read" operation is a scan on the history table to find the last value reported to the system for a sensor. This value is then put in visualizations, tables and similar. This is the same that is used when Zabbix web interface lists the last timestamp and value for a host in it's last data screen.
The code for this is in PHP, and uses the ZBX_HISTORY_PERIOD=86400 constant
($period in the code below) to limit how far back in time it looks. This
code
follows a pretty traditional anti-pattern of doing 10 000 little queries that
are all too small to be slow by themselves, yet totally causing a large time
spent. This means it's not going to show in any slow query log.
    public function getLast(array $items, $limit = 1, $period = null) {
        $rs = [];
        foreach ($items as $item) {
            $values = DBfetchArray(DBselect(
                'SELECT *'.
                ' FROM '.self::getTableName($item['value_type']).' h'.
                ' WHERE h.itemid='.zbx_dbstr($item['itemid']).
                    ($period ? ' AND h.clock>'.(time() - $period) : '').
                ' ORDER BY h.clock DESC',
                $limit
            ));
            if ($values) {
                $rs[$item['itemid']] = $values;
            }
        }
        return $rs;
    }
A better way would be to pick out the value_type, and then use
count(value_type) queries to get the last data. However, knowing that this
query exists, and is the most common one, we can optimize for it.
For Zabbix, you cannot just replace the normal BTree index on history tables with a brin one. The above function would cause several thousand queries against the database, where each query would hit the index, and be forced to scan a block of pages on the disk. Trust me, I tried.
However, when we know that $period will be 86400, we can optimize for this specific function, by creating a btree index that covers this part, and using brin for the rest of the table. Sadly, a partial index cannot have a dynamic function in it's where-clause, so it has to be regenerated regularly.
To fix this, we run a script like the below once every night:
#!/bin/bash
database=${1:-zabbix}
cutoff=$[$(date +%s) - 2*86400]

psql -d zabbix << __EOF__
    BEGIN;
    DROP INDEX IF EXISTS history_backpeek_temp;
    CREATE INDEX history_backpeek_temp ON history (itemid, clock) WHERE clock >= ${cutoff};
    DROP INDEX IF EXISTS history_backpeek;
    ALTER INDEX history_backpeek_temp RENAME TO history_backpeek;
    COMMIT;
__EOF__
This will create a history_backpeek index, which allows the query optimizer
to use that for getLast operations. As a side note, it would actually be
quite nice if Postgres could use the existing index to build the new one.
With our lastValue-optimized history_backpeek index in place, we can
replace the main itemid,clock btree-index with brin ones.
drop index history_1;
create index history_1 on history using brin (itemid, clock);

drop index history_str_1;
create index history_str_1 on history_str using brin (itemid, clock);

drop index history_log_1;
create index history_log_1 on history_log using brin (itemid, clock);

drop index history_text_1;
create index history_text_1 on history_text using brin (itemid, clock);

drop index history_uint_1;
create index history_uint_1 on history_uint using brin (itemid, clock);
Note that you want to shut down Zabbix & frontends when doing this, or wrap each in a transaction.
Benefits
So, I can't come here and make these claims and suggestions without some numbers to back it up with. We saw a 60% space reduction on ONE system from the OID reduction. Other systems saw a more modest 13-15% reduction in space.
The move towards brin indexes is hairier, and requires some more forethought. I have not been benchmarking history data (get history for 5-7 days via API), so I cannot tell for sure what the performance impact is.
Disk impact, this is a measure on a simple 15GiB history_uint-table:
| index | size |
|---|---|
| history_uint_btree | 9401 MB |
| history_uint_brin | 688 kB |
| history_backpeek | 743 MB |
Yes, a freshly created btree index uses nearly 10GiB, 60% of the table, while the corresponding brin index uses below a megabyte. The constrained backpeek index instead uses around 5% of the table size, and covers approximately 7% of the total samples in the table.
In real numbers, replacing btree indexes with brin counts for a disk usage reduction of around 35%.

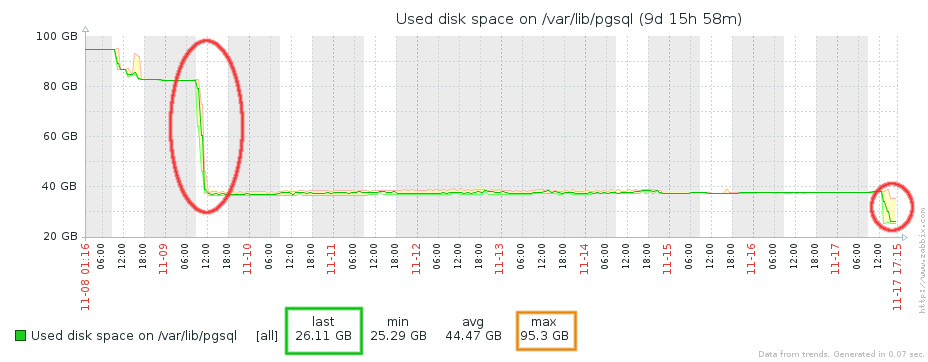
The total view after all these changes look like this:

Sorting the table
To further optimize for a brin type index, it helps to have the table sorted. Especially if you have ever used the zabbix housekeeper.
The below will first index the entire table, then cluster (rebuild) it, and
then drop the index. Warning, it will take time to run. And require a fair bit
of disk space. pg_repack is a better choice as you can run it in production
without locking the entire table.
Make sure you stop Zabbix first, and schedule a maintenance window.
create index history_sort on history (clock);
cluster history using history_sort;
drop index history_sort;

create index history_sort on history_uint (clock);
cluster history_uint using history_sort;
drop index history_sort;

create index history_sort on history_str (clock);
cluster history_str using history_sort;
drop index history_sort;

create index history_sort on history_log (clock);
cluster history_log using history_sort;
drop index history_sort;

create index history_sort on history_text (clock);
cluster history_text using history_sort;
drop index history_sort;
Update ( 2016-11-14 )
We found out that since web tests use an unlimited backpeek on the history_uint table when you configure it (to show when the test last ran), you may find it is impossible to modify web tests.
The patch at ZBX-11482 for the zabbix php frontend fixes that.
Update ( 2016-11-17 )
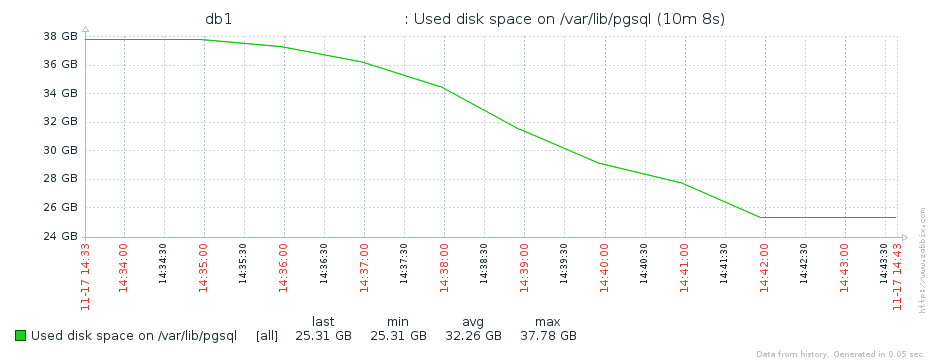
Added more complete index handling scripts, added a screenshot of replacing the indexes in production.
Total shrinkage was from 95GB down to 25GB, a reduction with approximately 75%, from removing OID and replacing the indexes.
By: D.S. Ljungmark
